
When first logging in to Utility Cloud you're brought to the Landing Page, and the dashboard on the Landing Page is how you'll access virtually every other part of Utility Cloud. When not on the Landing Page, you can quickly navigate to other parts of Utility Cloud with the navigation bar available on other pages.
The dashboard
Every user has a default dashboard assigned to them in Utility Cloud that's displayed when they first log in. From your dashboard, you'll see tiles to the pages you have access to and various widgets that give you quick insights into your data.
At a basic level, every user's default dashboard will show tiles to the different pages you have access to, but depending on your security rights you can customize your dashboard even further with different widgets depending on your needs. You can also create multiple dashboards for your user to switch between, each customized for different purposes.
What's on your dashboard?
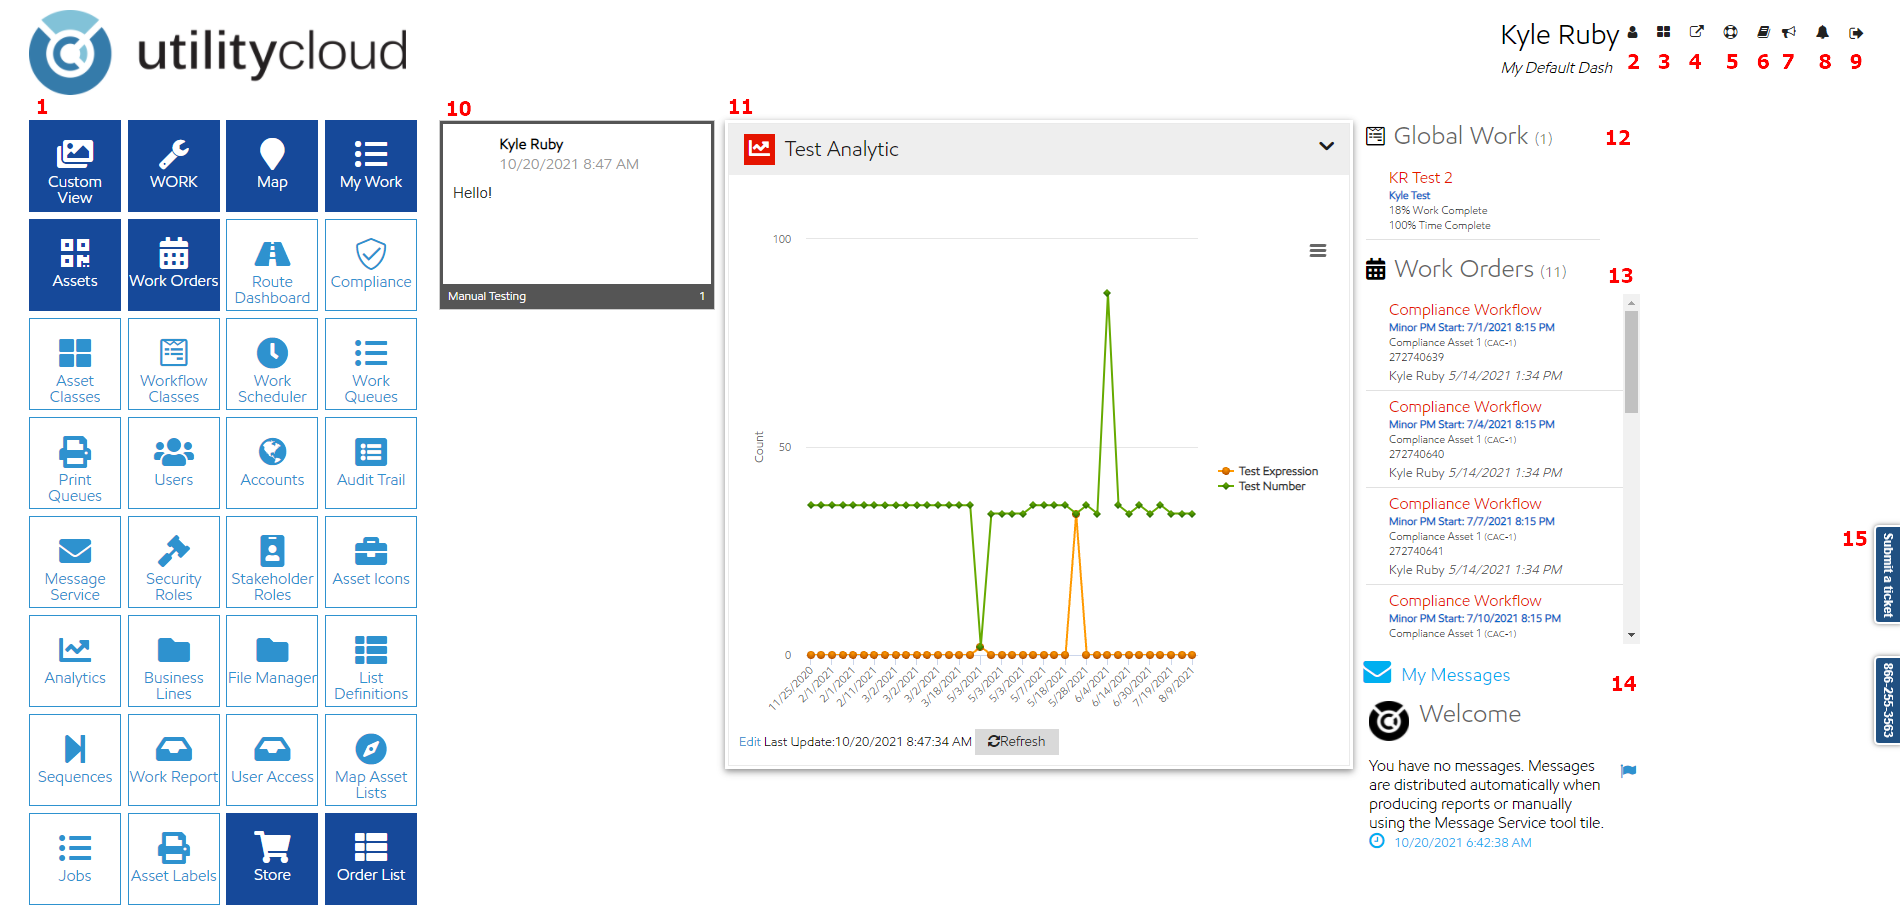
Below is each section of your dashboard labeled with a brief description.
-
Tiles: Each tile allows you to access a page or group of pages in Utility Cloud, and your access to tiles is determined by the security rights in your security roles or role exceptions.
-
User Profile and Preferences: This brings you to the User Details page for your user. From here you can modify your user's settings. For more information on editing your user, see our help file here.
-
Edit Default Dashboard: This allows you to edit what's on your current dashboard, reset it to its default settings, or create an entirely new dashboard.
-
Select a dashboard: This allows you to switch between dashboards if you have more than one.
-
Help and Support: This brings you directly to the home page for our help system.
-
Terms and Conditions: Opens the Utility Cloud terms and conditions for review.
-
Announcements: Shows the most recent announcements around enhancements or other news in Utility Cloud.
-
Job Processing: This shows the progress of your imports, exports, and other jobs here. If you have any jobs in progress, you will see In Progress :gear_icon_in_progress: instead of Complete :bell_icon_job_processing:.
-
Log Out: Logs you out of Utility Cloud.
-
Whiteboard: Allows you to leave messages for other users and see messages left by other users in each account you're assigned.
-
Analytics: Shows any analytics you've configured on the dashboard for quick insight into your workflow data.
-
Global Work: Shows any scheduled work where you're a stakeholder on that work schedule along with the percentage of that work completed.
-
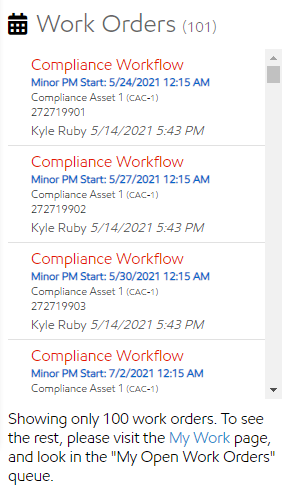
Work Orders: Shows all open work orders assigned to you, with a limit of 500. If you'd like to see past that limit, then you can see all of your open work orders from My Work in the automatically-generated My Open Work Orders work queue or by searching on the Work Order Search.
-
My Messages: Shows any system-generated messages to your user like success/fail notifications for an import or export, auto-generated reports where you are a stakeholder, or manual messages sent by another user through the Messages page.
-
Submit a ticket: This allows you to submit a ticket to our technical help desk through Zendesk. For more information, see Technical Support Tickets.
-
Scan and Go (not pictured): Allows you to scan either your asset tags or asset labels to be brought directly to the Asset Details of your asset.
Configuring your dashboard
To add any widget to your dashboard you have access to, select Edit Default Dashboard:default_dashboard:, then select the widget you want to add from the list. That widget will be added to your dashboard and depending on which it is may need some additional configuration.
My Messages
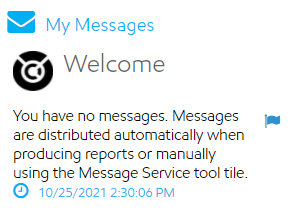
To add the My Messages widget, select Messages when editing your dashboard.
To edit the My Messages widget, select Settings :gear_icon_in_progress: .
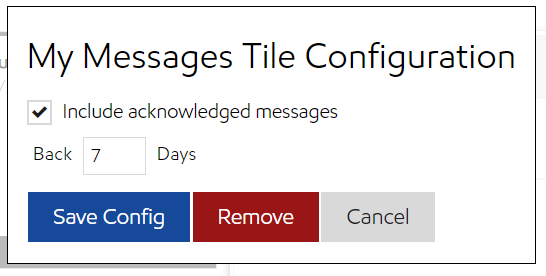
From here, you can choose to include acknowledged messages or not and set the number of days back your messages should show.
Security Rights Required: View Tile Messages
Whiteboard
To add the Whiteboard widget, select Whiteboard when editing your dashboard.
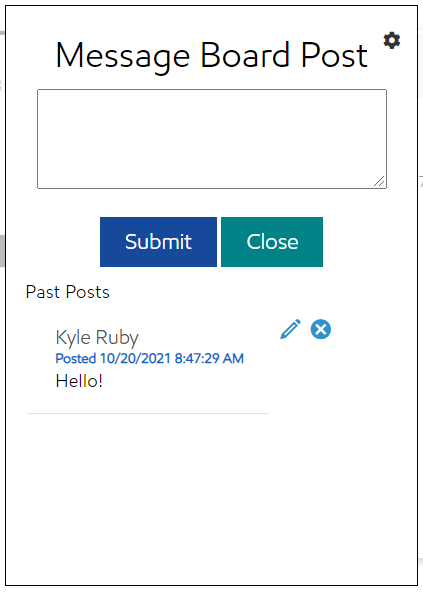
The whiteboard will show the most recently posted message for the chosen account along with the name of the user and when they posted it.
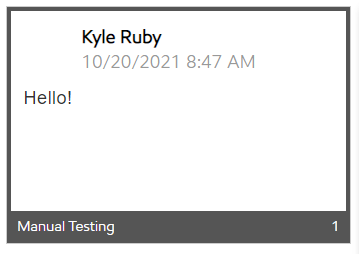
You can view more messages or add your own by selecting the whiteboard widget itself, or edit or delete one of your messages.
To edit your whiteboard's configuration, select Settings:gear_icon_in_progress:when viewing messages.
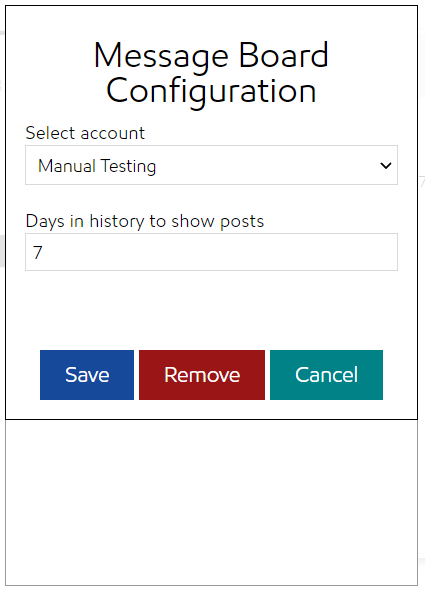
From here, you can change the account you see and the number of days previous to show. You can also remove the whiteboard from your dashboard.
Security Rights Required: View Tile Whiteboard
Analytics
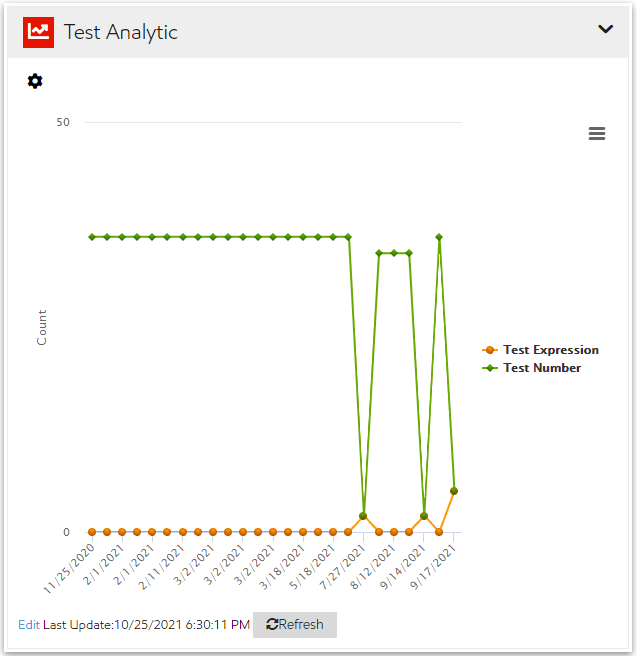
To add the Analytics widget, select Analytics when editing your dashboard. You'll then need to select Settings :gear_icon_in_progress: to select an existing analytic for the widget to show.
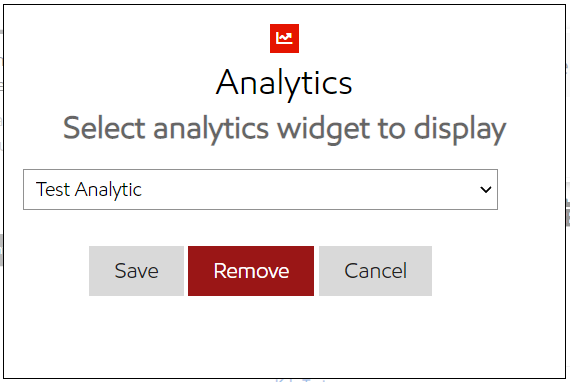
You can also change your analytic used on the widget or remove the widget entirely from your dashboard here. For more information on creating analytics see Managing Analytics.
Security Rights Required: View Tile Analytics
Work Orders
To add the Work Orders widget, select Requested Work when editing your dashboard. The Work Orders widget will show all of your assigned work orders.
To remove the Work Orders widget, select Settings :gear_icon_in_progress:, then select Remove.
Security Rights Required: View Tile Requested Work
Global Work
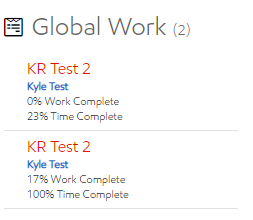
Select Scheduled Work when editing your dashboard to add the Global Work widget Global Work widget will show all scheduled work where you're a stakeholder on the work schedule.
To remove the Work Orders widget, select Settings :gear_icon_in_progress:, then select Remove.
Security Rights Required: View Tile Scheduled Work
Scan and Go
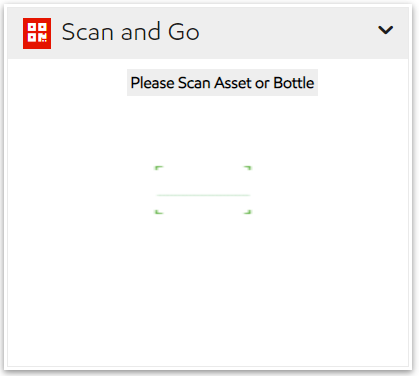
To add the Scan and Go widget, select QR Tool tile when editing your dashboard.
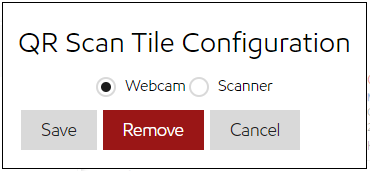
By default, the Scan and Go widget will attempt to use your device's camera. If you instead have a hand scanner, to switch select Settings :gear_icon_in_progress:, select Scanner, then save. From the same view, select Remove to remove the widget.
Security Rights Required: View Tile QR Code Scanner
Resetting my dashboard
If you need to reset your dashboard to its default state (if tiles are missing or duplicated):
-
Select Edit Default Dashboard :default_dashboard:.
-
Select Reset Tiles.
Your dashboard will be reset to its default state, containing only Global Work, Work Orders, and My Messages.
Security Rights Required: View Tile Tools
The navigation bar
Outside of the Landing Page, you can navigate across Utility Cloud with the standard navigation bar across the top of your screen. The nav bar allows much many of the same navigation options as the Landing Page.

-
Tiles: When you select Navigation :navbar_navigation:, a list of all your tiles appears, the same as what you see on the dashboard. Each tile allows you to access a page or group of pages in Utility Cloud, and your access to tiles is determined by the security rights in your security roles or role exceptions.
-
Landing Page: The Utility Cloud logo brings you back to the Landing Page.
-
User Profile: This brings you to the User Details page for your user. From here you can modify your user's settings.
-
Job Processing: This shows the progress of your imports, exports, and other jobs here. If you have any jobs in progress, you will see the In Progress :gear_icon_in_progress: instead of Complete :bell_icon_job_processing:.
-
Synchronize Work Queue: This brings you to the My Work Queues page where you can sync to keep your work queues up to date. If you have any unsubmitted work it will be indicated here by a count.
-
Support: This brings you to the home page for our help system.
-
Page Help: This brings you directly to the help page for your current page if one is available.
-
Sign Out: Logs you out of Utility Cloud.
Job processing
On any page, you can check the progress of most jobs running by selecting In Progress :gear_icon_in_progress:if any job is currently in progress or Complete :bell_icon_job_processing: if all of your jobs have been completed. Jobs most often include imports or exports but can also include ESRI syncs or deleting or archiving assets.
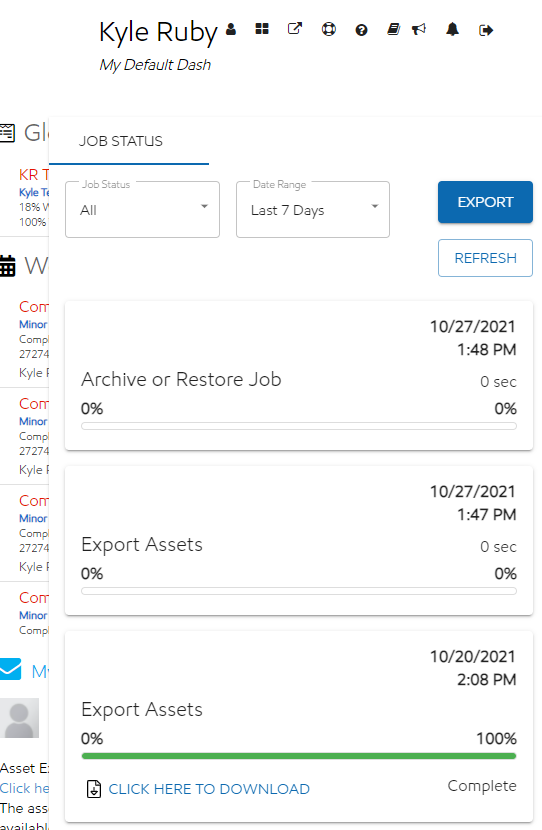
Jobs can be filtered by Status with options for Incomplete, Complete, or Both; or by Date Range with options Last 24 Hours, Last 7 Days, or Last 180 Days. By default, the job processing panel shows any incomplete jobs within the last 24 hours.
You can also refresh the status of your jobs by selecting REFRESH or export a list of all your jobs in your current filter to Excel by selecting EXPORT.
Related articles