
Create Analytics
-
Navigate to the Analytics tile on the Dashboard or from the left navigation menu.
-
Select the Create link (located directly to the right of the search bar) to access the Analytics page.
-
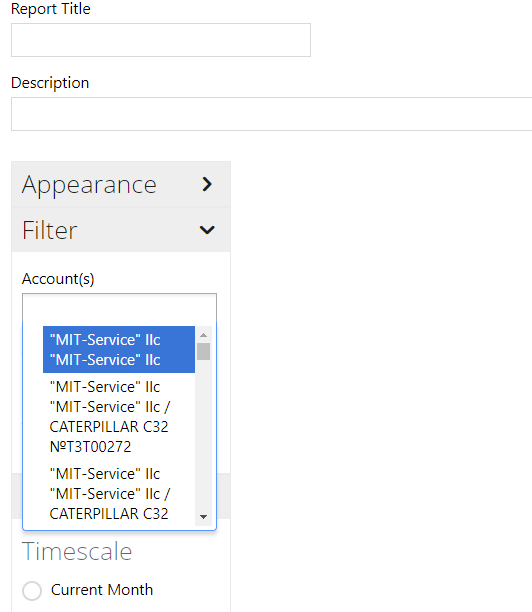
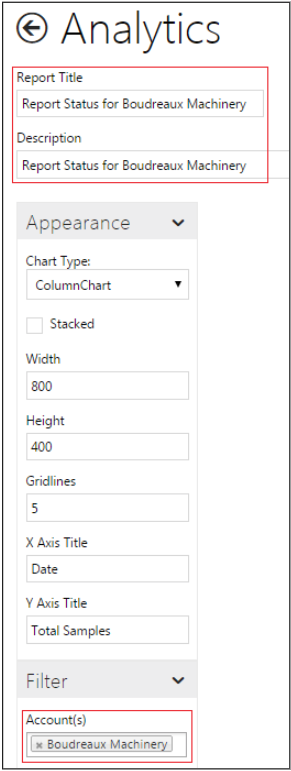
Use the Report Title and Description fields to assign a name to the new analytic.
-
Use the various fields within the Appearance dropdown to format the new chart.
-
The Chart Type can be modified using the designated dropdown.
-
The graph dimensions can be adjusted in the Width and Height fields.
-
Axis labels and the number of Gridlines can also be specified in the appropriate fields.
-
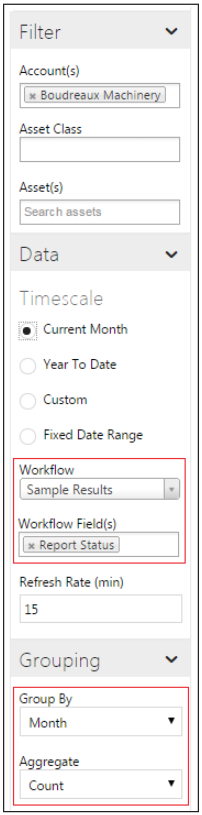
The Filter dropdown is used to select the desired Account, Asset Class or specific Assets.
-
Within the Data dropdown , specify the time frame, the desired workflow (i.e. In Service Oil Sample or Sample Results), and the specific workflow field in the corresponding labeled fields.
-
Use the Grouping dropdown to specify the data grouping and aggregation.
-
Once all desired information has been specified, verify that the Active box at the top of the page is checked,
-
Select the Save at the bottom of the page.

Edit Analytics
-
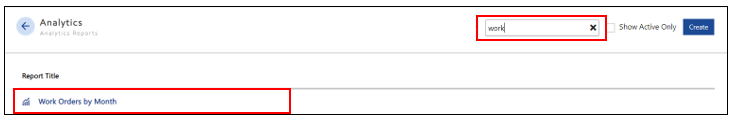
Navigate to the Analytics tile on the Landing Page.
-
Use the Search bar to locate the existing analytic.
-
Select the analytic from the search results in order to access the Analytics page.
-
Update any information as desired.
-
Select Save at the bottom of the page.
Display Analytics on the Dashboard
-
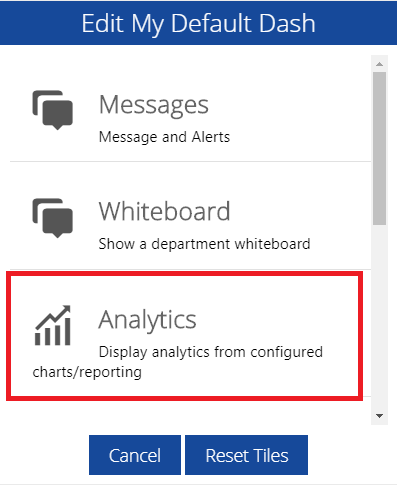
Navigate to the top right corner of the Landing Page and select Edit Default Dashboard.
-
In the window that appears, select Analytics.
-
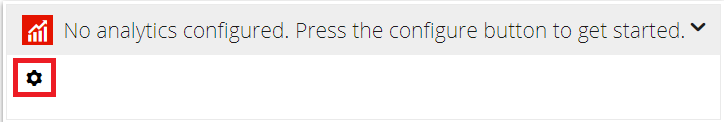
The default Analytics widget will appear on the dash.
-
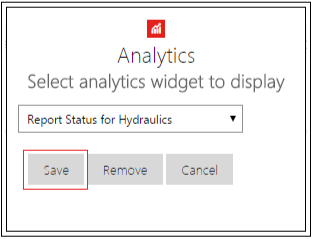
Select Configure in order to select the desired Analytics report from the dropdown.
-
Select Save to finalize the widget configuration.
-
Verify that the correct chart appears on your Dashboard.
Related articles
Filter by label
There are no items with the selected labels at this time.